Charts can display data as visual graphs, so that we can easily find the key information behind the data, like the proportion of sales based on region, the trend of data over time, etc. In this article, I am going to introduce how to create a clustered column chart, a pie chart and a line chart in a PowerPoint document by using Spire.Presentation for Java.
Installing Spire.Presentation.jar
If you use Maven, you can easily import the Spire.Presentation.jar in your application using the following configurations. For non-Maven projects, please download the jar file from this link and add it as a dependency in your program.
<repositories>
<repository>
<id>com.e-iceblue</id>
<name>e-iceblue</name>
<url>https://repo.e-iceblue.com/nexus/content/groups/public/</url>
</repository>
</repositories>
<dependencies>
<dependency>
<groupId> e-iceblue </groupId>
<artifactId>spire.presentation</artifactId>
<version>4.10.1</version>
</dependency>
</dependencies>
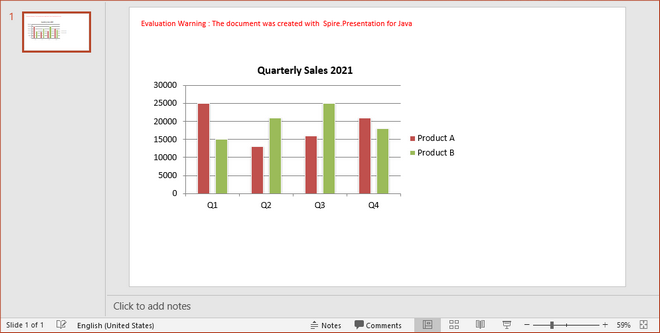
Example 1. Create a Clustered Column Chart
import com.spire.presentation.FileFormat;
import com.spire.presentation.Presentation;
import com.spire.presentation.SlideSizeType;
import com.spire.presentation.charts.ChartStyle;
import com.spire.presentation.charts.ChartType;
import com.spire.presentation.charts.IChart;
import java.awt.geom.Rectangle2D;
import java.math.BigDecimal;
public class CreateColumnChart {
public static void main(String[] args)
throws Exception {
//Create a PowerPoint document
Presentation presentation = new Presentation();
presentation.getSlideSize().setType(SlideSizeType.SCREEN_16_X_9);
//Insert a clustered column chart
Rectangle2D.Float rect = new Rectangle2D.Float(40, 100, 600, 300);
IChart chart = presentation.getSlides().get(0).getShapes().appendChart(ChartType.COLUMN_CLUSTERED, rect);
//Set chart title
chart.getChartTitle().getTextProperties().setText("Quarterly Sales 2021");
chart.getChartTitle().getTextProperties().isCentered(true);
chart.getChartTitle().setHeight(30f);
chart.hasTitle(true);
//Create a String[][] array to store data
String[][] data = new
String[][]{
{"Quarterly Sales
2021", "Product A", "Product B"},
{"Q1", "25000", "15000"},
{"Q2", "13000", "21000"},
{"Q3", "16000", "25000"},
{"Q4", "21000", "18000"}
};
//Loop through the elements in the array
for (int i = 0; i < data.length; i++) {
for (int j = 0; j < data[0].length; j++) {
int number;
//If a string can be converted to a
integer
if (isNum(data[i][j])) {
//Convert
string to integer
number =
Integer.parseInt(data[i][j]);
//Write the int
value into the chart
chart.getChartData().get(i,
j).setValue(number);
} else {
//Write the
string value into the chart
chart.getChartData().get(i,
j).setValue(data[i][j]);
}
}
}
//Set series label
chart.getSeries().setSeriesLabel(chart.getChartData().get("B1", "C1"));
//Set category labels
chart.getCategories().setCategoryLabels(chart.getChartData().get("A2", "A5"));
//Set series values
chart.getSeries().get(0).setValues(chart.getChartData().get("B2", "B5"));
chart.getSeries().get(1).setValues(chart.getChartData().get("C2", "C5"));
//Set chart style
chart.setChartStyle(ChartStyle.STYLE_10);
//Set overlap value
chart.setOverLap(-50);
//Set gap width
chart.setGapWidth(200);
//Save to file
presentation.saveToFile("output/ClusteredColumnChart.pptx", FileFormat.PPTX_2013);
}
//Determine if a string can be converted to a integer
public static boolean isNum(String str) {
try {
new BigDecimal(str);
return true;
} catch (Exception e) {
return false;
}
}
}
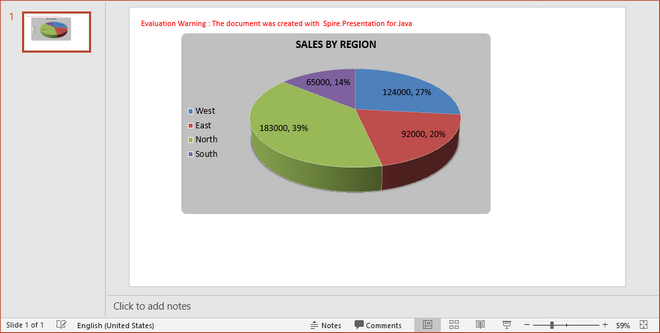
Example 2. Create a Pie Chart
import com.spire.presentation.FileFormat;
import com.spire.presentation.Presentation;
import com.spire.presentation.SlideSizeType;
import com.spire.presentation.charts.ChartLegendPositionType;
import com.spire.presentation.charts.ChartStyle;
import com.spire.presentation.charts.ChartType;
import com.spire.presentation.charts.IChart;
import com.spire.presentation.drawing.FillFormatType;
import java.awt.*;
import java.awt.geom.Rectangle2D;
public class CreatePieChart {
public static void main(String[] args)
throws Exception {
//Create a Presentation object
Presentation presentation = new Presentation();
presentation.getSlideSize().setType(SlideSizeType.SCREEN_16_X_9);
//Insert a pie chart
Rectangle2D.Double rect = new Rectangle2D.Double(100, 50, 600, 350);
IChart chart = presentation.getSlides().get(0).getShapes().appendChart(ChartType.PIE_3_D, rect);
//Set title
chart.getChartTitle().getTextProperties().setText("SALES BY REGION");
chart.getChartTitle().getTextProperties().isCentered(true);
chart.getChartTitle().setHeight(30);
chart.hasTitle(true);
//Write data to chart as chart data
chart.getChartData().get(0,0).setText("Regions");
chart.getChartData().get(1,0).setText("West");
chart.getChartData().get(2,0).setText("East");
chart.getChartData().get(3,0).setText("North");
chart.getChartData().get(4,0).setText("South");
chart.getChartData().get(0,1).setText("Sales");
chart.getChartData().get(1,1).setNumberValue(124000);
chart.getChartData().get(2,1).setNumberValue(92000);
chart.getChartData().get(3,1).setNumberValue(183000);
chart.getChartData().get(4,1).setNumberValue(65000);
//Set series labels
chart.getSeries().setSeriesLabel(chart.getChartData().get("B1","B1"));
//Set categories labels
chart.getCategories().setCategoryLabels(chart.getChartData().get("A2", "A5"));
//Assign data to series values
chart.getSeries().get(0).setValues(chart.getChartData().get("B2", "B5"));
//Display values in data labels
chart.getSeries().get(0).getDataLabels().setLabelValueVisible(true);
chart.getSeries().get(0).getDataLabels().setPercentValueVisible(true);
//Apply built-in chart style
chart.setChartStyle(ChartStyle.STYLE_10);
//Set chart legend position
chart.getChartLegend().setPosition(ChartLegendPositionType.LEFT);
//Fill chart with solid color
chart.getFill().setFillType(FillFormatType.SOLID);
chart.getFill().getSolidColor().setColor(Color.lightGray);
//Save to file
presentation.saveToFile("output/PieChart.pptx", FileFormat.PPTX_2016);
}
}
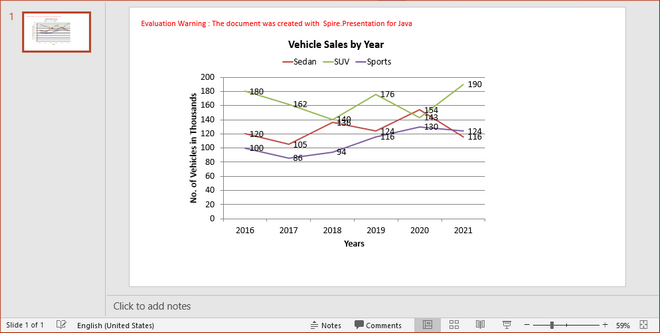
Example 3. Create a Line Chart
import com.spire.presentation.FileFormat;
import com.spire.presentation.Presentation;
import com.spire.presentation.SlideSizeType;
import com.spire.presentation.charts.ChartLegendPositionType;
import com.spire.presentation.charts.ChartType;
import com.spire.presentation.charts.IChart;
import java.awt.geom.Rectangle2D;
public class CreateLineChart {
public static void main(String[] args)
throws Exception {
//Create a Presentation object
Presentation presentation = new Presentation();
presentation.getSlideSize().setType(SlideSizeType.SCREEN_16_X_9);
//Insert a line chart
Rectangle2D.Double rect = new Rectangle2D.Double(100, 50, 600, 430);
IChart chart = presentation.getSlides().get(0).getShapes().appendChart(ChartType.LINE, rect);
//Set chart title
chart.getChartTitle().getTextProperties().setText("Vehicle Sales by Year");
chart.getChartTitle().getTextProperties().isCentered(true);
chart.getChartTitle().setHeight(30);
chart.hasTitle(true);
//Set axis title
chart.getPrimaryCategoryAxis().getTitle().getTextProperties().setText("Years");
chart.getPrimaryCategoryAxis().hasTitle(true);
chart.getPrimaryValueAxis().getTitle().getTextProperties().setText("No. of Vehicles in
Thousands");
chart.getPrimaryValueAxis().hasTitle(true);
//Write data to chart as chart data
chart.getChartData().get(0,0).setText("Year");
chart.getChartData().get(1,0).setText("2016");
chart.getChartData().get(2,0).setText("2017");
chart.getChartData().get(3,0).setText("2018");
chart.getChartData().get(4,0).setText("2019");
chart.getChartData().get(5,0).setText("2020");
chart.getChartData().get(6,0).setText("2021");
chart.getChartData().get(0,1).setText("Sedan");
chart.getChartData().get(1,1).setNumberValue(120);
chart.getChartData().get(2,1).setNumberValue(105);
chart.getChartData().get(3,1).setNumberValue(136);
chart.getChartData().get(4,1).setNumberValue(124);
chart.getChartData().get(5,1).setNumberValue(154);
chart.getChartData().get(6,1).setNumberValue(116);
chart.getChartData().get(0,2).setText("SUV");
chart.getChartData().get(1,2).setNumberValue(180);
chart.getChartData().get(2,2).setNumberValue(162);
chart.getChartData().get(3,2).setNumberValue(140);
chart.getChartData().get(4,2).setNumberValue(176);
chart.getChartData().get(5,2).setNumberValue(143);
chart.getChartData().get(6,2).setNumberValue(190);
chart.getChartData().get(0,3).setText("Sports");
chart.getChartData().get(1,3).setNumberValue(100);
chart.getChartData().get(2,3).setNumberValue(86);
chart.getChartData().get(3,3).setNumberValue(94);
chart.getChartData().get(4,3).setNumberValue(116);
chart.getChartData().get(5,3).setNumberValue(130);
chart.getChartData().get(6,3).setNumberValue(124);
//Set series labels
chart.getSeries().setSeriesLabel(chart.getChartData().get("B1", "D1"));
//Set categories labels
chart.getCategories().setCategoryLabels(chart.getChartData().get("A2", "A7"));
//Assign data to series values
chart.getSeries().get(0).setValues(chart.getChartData().get("B2", "B7"));
chart.getSeries().get(1).setValues(chart.getChartData().get("C2", "C7"));
chart.getSeries().get(2).setValues(chart.getChartData().get("D2", "D7"));
//Display values in data labels
chart.getSeries().get(0).getDataLabels().setLabelValueVisible(true);
chart.getSeries().get(1).getDataLabels().setLabelValueVisible(true);
chart.getSeries().get(2).getDataLabels().setLabelValueVisible(true);
//Set chart legend position
chart.getChartLegend().setPosition(ChartLegendPositionType.TOP);
//Save to file
presentation.saveToFile("output/LineChart.pptx", FileFormat.PPTX_2016);
}
}
Write a comment