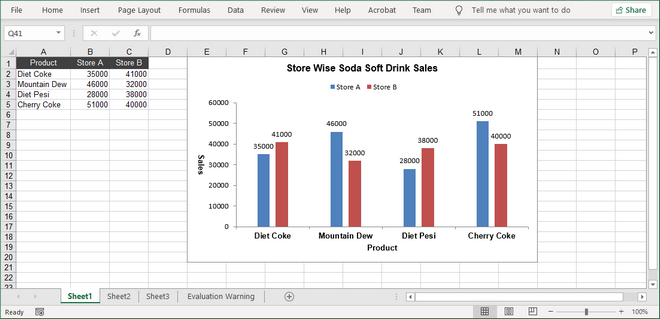
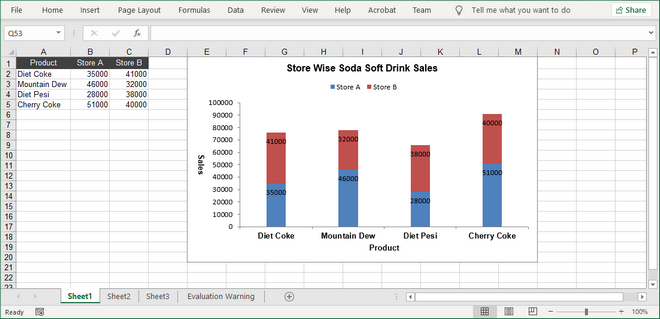
Clustered column chart and stacked column chart are two variants of column chart. A clustered column chart allows easy comparison of values across various categories, while a stacked column chart shows both the total of a different categories and the proportion of each constituent value.
In this article, I am going to introduce how to create clustered or stacked column charts by using Spire.XLS for Java.
Installing Spire.Xls.jar
If you use Maven, you can easily import the jar in your application by adding the following code to your project’s pom.xml file. For non-Maven projects, download the jar file from this link and add it as a dependency in your application.
<repositories>
<repository>
<id>com.e-iceblue</id>
<name>e-iceblue</name>
<url>http://repo.e-iceblue.com/nexus/content/groups/public/</url>
</repository>
</repositories>
<dependencies>
<dependency>
<groupId> e-iceblue</groupId>
<artifactId>spire.xls</artifactId>
<version>4.8.1</version>
</dependency>
</dependencies>
Example 1. Create a clustered column chart
import com.spire.xls.*;
import com.spire.xls.charts.ChartSerie;
import com.spire.xls.charts.ChartSeries;
import java.awt.*;
public class CreateColumnChart {
public static void main(String[] args) {
//Create a Workbook object
Workbook workbook = new
Workbook();
//Get the first sheet
Worksheet sheet = workbook.getWorksheets().get(0);
//Set chart data
sheet.getCellRange("A1").setValue("Product");
sheet.getCellRange("A2").setValue("Diet Coke");
sheet.getCellRange("A3").setValue("Mountain Dew");
sheet.getCellRange("A4").setValue("Diet Pesi");
sheet.getCellRange("A5").setValue("Cherry Coke");
sheet.getCellRange("B1").setValue("Store A");
sheet.getCellRange("B2").setNumberValue(35000);
sheet.getCellRange("B3").setNumberValue(46000);
sheet.getCellRange("B4").setNumberValue(28000);
sheet.getCellRange("B5").setNumberValue(51000);
sheet.getCellRange("C1").setValue("Store B");
sheet.getCellRange("C2").setNumberValue(41000);
sheet.getCellRange("C3").setNumberValue(32000);
sheet.getCellRange("C4").setNumberValue(38000);
sheet.getCellRange("C5").setNumberValue(40000);
//Set cell style
sheet.getCellRange("A1:C1").setRowHeight(15);
sheet.getCellRange("A1:C1").getCellStyle().setColor(Color.darkGray);
sheet.getCellRange("A1:C1").getCellStyle().getExcelFont().setColor(Color.white);
sheet.getCellRange("A1:C1").getCellStyle().setVerticalAlignment(VerticalAlignType.Center);
sheet.getCellRange("A1:C1").getCellStyle().setHorizontalAlignment(HorizontalAlignType.Center);
sheet.autoFitColumn(1);
//Add a chart to the sheet
Chart chart = sheet.getCharts().add(ExcelChartType.ColumnClustered);
//Set data range of chart
chart.setDataRange(sheet.getCellRange("A1:C5"));
chart.setSeriesDataFromRange(false);
//Set position of the chart
chart.setLeftColumn(5);
chart.setTopRow(1);
chart.setRightColumn(14);
chart.setBottomRow(21);
//Set chart title
chart.setChartTitle("Store Wise
Soda Soft Drink Sales");
chart.getChartTitleArea().isBold(true);
chart.getChartTitleArea().setSize(12);
//Set axis title
chart.getPrimaryCategoryAxis().setTitle("Product");
chart.getPrimaryCategoryAxis().getFont().isBold(true);
chart.getPrimaryCategoryAxis().getTitleArea().isBold(true);
chart.getPrimaryValueAxis().setTitle("Sales");
chart.getPrimaryValueAxis().hasMajorGridLines(false);
chart.getPrimaryValueAxis().getTitleArea().isBold(true);
chart.getPrimaryValueAxis().getTitleArea().setTextRotationAngle(90);
//Set series color, overlap, gap width and data labels
ChartSeries series = chart.getSeries();
for (int i = 0 ; i < series.size() ; i++) {
ChartSerie cs = series.get(i);
cs.getFormat().getOptions().isVaryColor(true);
cs.getFormat().getOptions().setOverlap(-50);
cs.getFormat().getOptions().setGapWidth(350);
cs.getDataPoints().getDefaultDataPoint().getDataLabels().hasValue(true);
}
//Set legend position
chart.getLegend().setPosition(LegendPositionType.Top);
//Save the document
workbook.saveToFile("output/ClusteredColumnChart.xlsx", ExcelVersion.Version2016);
}
}
Example 2. Create a stacked column chart
import com.spire.xls.*;
import com.spire.xls.charts.ChartSerie;
import com.spire.xls.charts.ChartSeries;
import java.awt.*;
public class CreateColumnChart {
public static void main(String[] args) {
//Create a Workbook object
Workbook workbook = new
Workbook();
//Get the first sheet
Worksheet sheet = workbook.getWorksheets().get(0);
//Set chart data
sheet.getCellRange("A1").setValue("Product");
sheet.getCellRange("A2").setValue("Diet Coke");
sheet.getCellRange("A3").setValue("Mountain Dew");
sheet.getCellRange("A4").setValue("Diet Pesi");
sheet.getCellRange("A5").setValue("Cherry Coke");
sheet.getCellRange("B1").setValue("Store A");
sheet.getCellRange("B2").setNumberValue(35000);
sheet.getCellRange("B3").setNumberValue(46000);
sheet.getCellRange("B4").setNumberValue(28000);
sheet.getCellRange("B5").setNumberValue(51000);
sheet.getCellRange("C1").setValue("Store B");
sheet.getCellRange("C2").setNumberValue(41000);
sheet.getCellRange("C3").setNumberValue(32000);
sheet.getCellRange("C4").setNumberValue(38000);
sheet.getCellRange("C5").setNumberValue(40000);
//Set cell style
sheet.getCellRange("A1:C1").setRowHeight(15);
sheet.getCellRange("A1:C1").getCellStyle().setColor(Color.darkGray);
sheet.getCellRange("A1:C1").getCellStyle().getExcelFont().setColor(Color.white);
sheet.getCellRange("A1:C1").getCellStyle().setVerticalAlignment(VerticalAlignType.Center);
sheet.getCellRange("A1:C1").getCellStyle().setHorizontalAlignment(HorizontalAlignType.Center);
sheet.autoFitColumn(1);
//Add a chart to the sheet
Chart chart = sheet.getCharts().add(ExcelChartType.ColumnStacked);
//Set data range of chart
chart.setDataRange(sheet.getCellRange("A1:C5"));
chart.setSeriesDataFromRange(false);
//Set position of the chart
chart.setLeftColumn(5);
chart.setTopRow(1);
chart.setRightColumn(14);
chart.setBottomRow(21);
//Set chart title
chart.setChartTitle("Store Wise
Soda Soft Drink Sales");
chart.getChartTitleArea().isBold(true);
chart.getChartTitleArea().setSize(12);
//Set axis title
chart.getPrimaryCategoryAxis().setTitle("Product");
chart.getPrimaryCategoryAxis().getFont().isBold(true);
chart.getPrimaryCategoryAxis().getTitleArea().isBold(true);
chart.getPrimaryValueAxis().setTitle("Sales");
chart.getPrimaryValueAxis().hasMajorGridLines(false);
chart.getPrimaryValueAxis().getTitleArea().isBold(true);
chart.getPrimaryValueAxis().getTitleArea().setTextRotationAngle(90);
//Set series color, gap width and data labels
ChartSeries series = chart.getSeries();
for (int i = 0 ; i < series.size() ; i++) {
ChartSerie cs = series.get(i);
cs.getFormat().getOptions().isVaryColor(true);
cs.getFormat().getOptions().setGapWidth(270);
cs.getDataPoints().getDefaultDataPoint().getDataLabels().hasValue(true);
cs.getDataPoints().getDefaultDataPoint().getDataLabels().setPosition(DataLabelPositionType.Inside);
}
//Set legend position
chart.getLegend().setPosition(LegendPositionType.Top);
//Save the document
workbook.saveToFile("output/StackedColumnChart.xlsx", ExcelVersion.Version2016);
}
}
Write a comment